Create Reports
Create Reports Using XLhubOverview
Audience
Flow of Events
1. Open an Excel file that contains a hubbed table. This table should have been saved many times possibly by multiple users.
2. In the XLhub Ribbon, click Reports.
You will notice that their are two options under the Reports button:
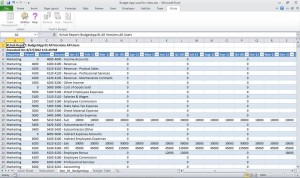
a. All Versions All Users : Displays every save by every user. All data written to the database will be displayed in this report. A report using All Versions All Users is useful if one user has saved a lot of different data (Example: Manager saved a log for each employee as a separate save) or if each users saved for different cycles (Example: Manager saved a forecast for January, February and March budget cycle as a separate entry).
If you choose All Versions All Users a new worksheet will open in front of the worksheet containing the hubbed table. The report will be in the form of a table and will look something like this:
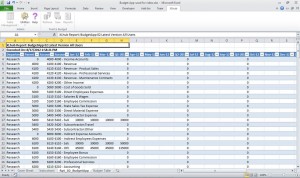
b. Latest Version All Users : Displays the most recent save by every user. Older data written to the database will not be displayed in this type of report. A report using Latest Version All Users is useful if you need to report on the most current data (Example: Sales Manager only needs to see the year end total from all of the Sales Reps).
If you choose Latest Version All Users a new worksheet will open in front of the worksheet containing the hubbed table. The report will be in the form of a table and will look something like this:
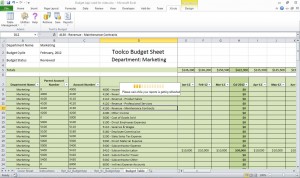
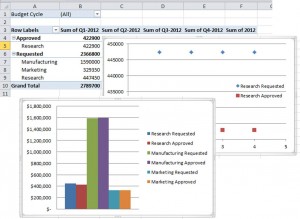
d. From the report table created you can create pivot tables and graphs to better display your data.
XLhub allows you to easily generate useful reports from your data.
LIVE CHAT

Contact
Phone
248.690.5250
contact@metricx.com
Address
Metric-X, LLC Rochester, Michigan 48307